Day of Week and Activity Type
Two new Dashboard options
Last quarter some new options were added to enable you to customise the display of the Navigator Dashboard. These are:
Metric: Day of Week
When chosen, this sets the y-axis of the Dashboard to show the day of the week.
Colour by: Activity Type
This enables you to colour each point on the Dashboard by the activity or sports type as an alternative to heart rate intensity (HRI). When this coloration is selected you’ll see that the points become diamonds rather than circles as a further cue that a different Colour by option is in play. On a large screen you’ll see a key at the bottom of the chart showing which colours correspond to which types of activity.
Using these two new options together, generates a display like this:
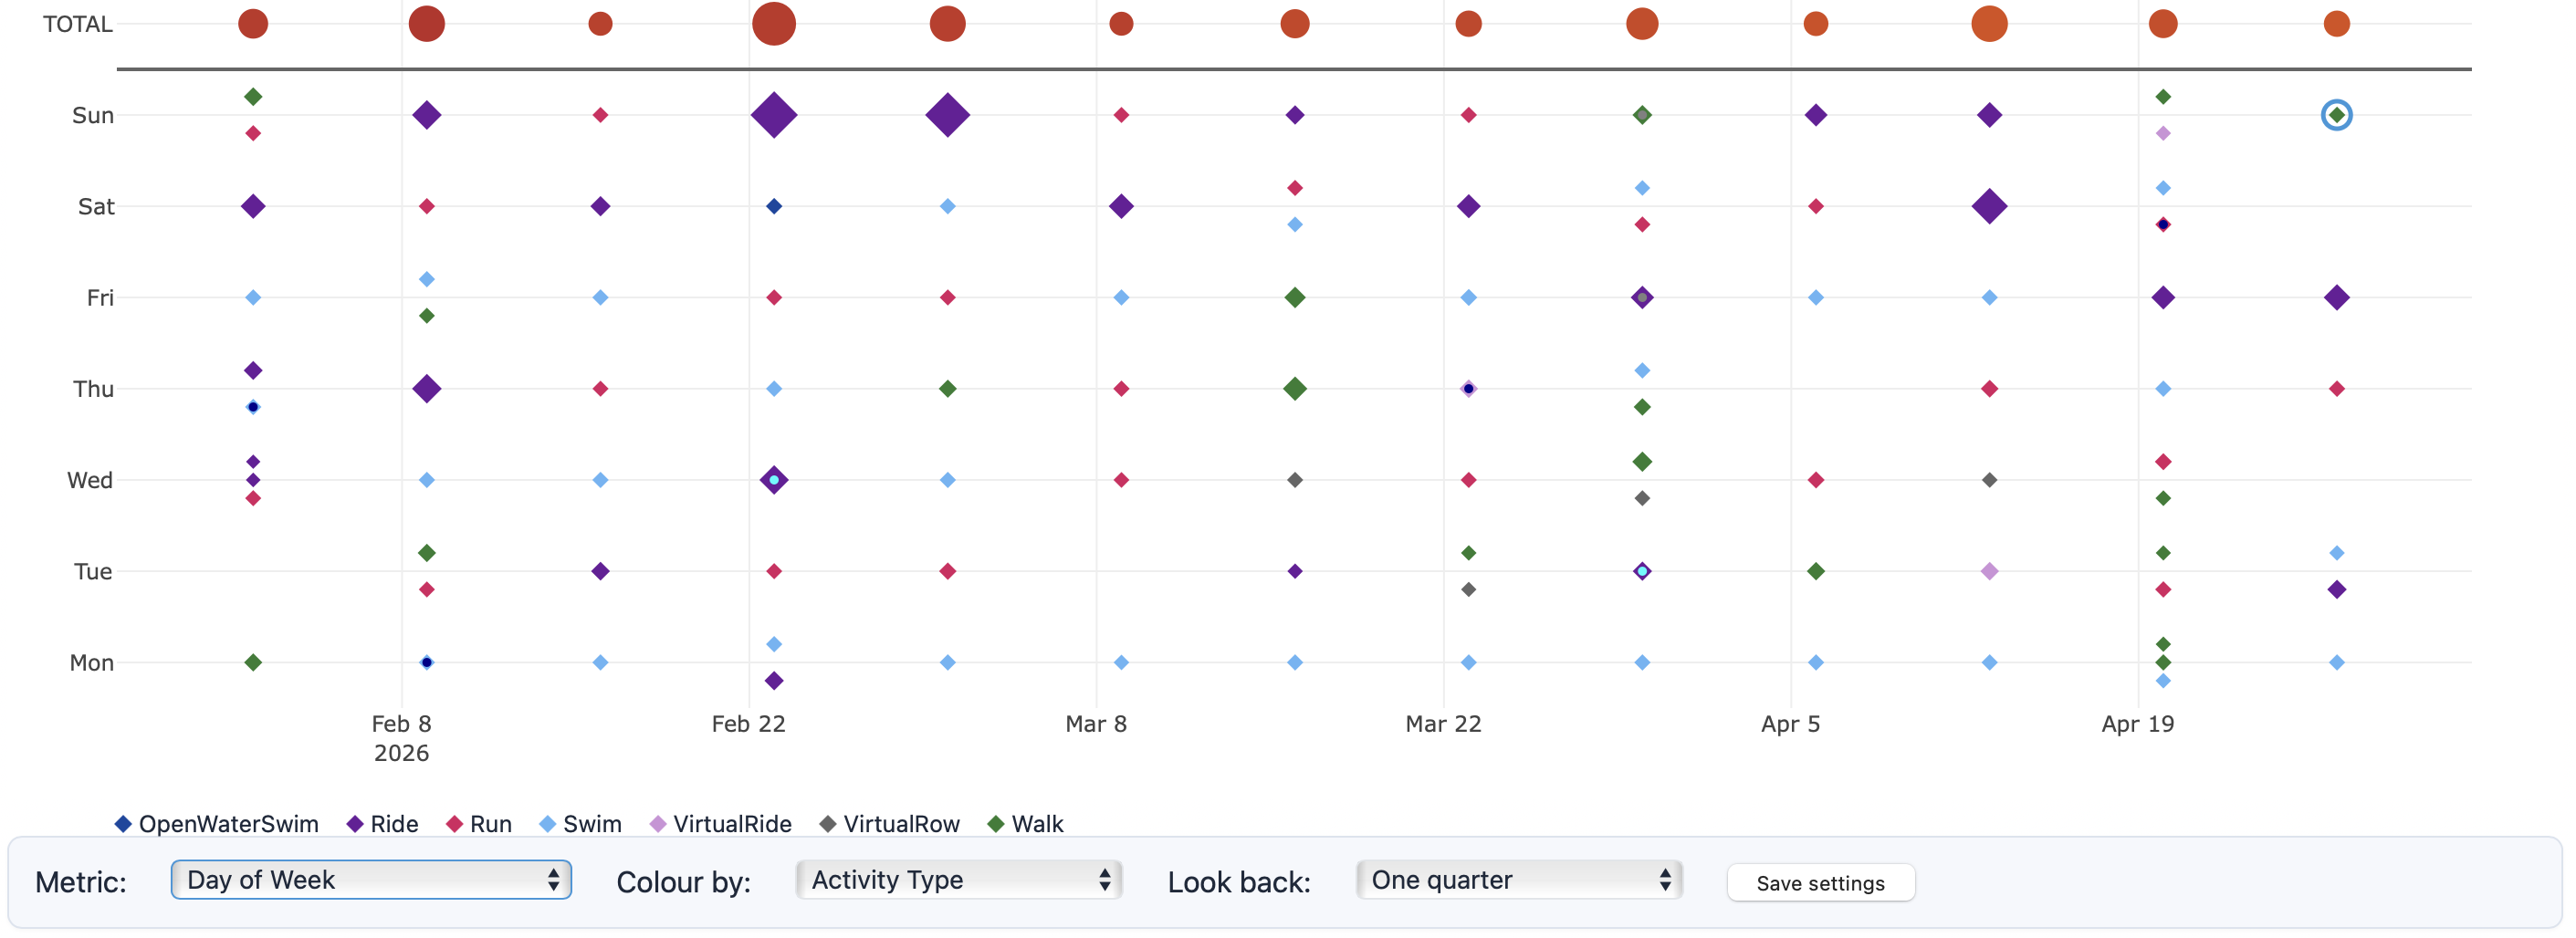
The TOTAL line indicates the effort for the week - to see the detail just hover over each point.
You can pick your preferred choice of Metric and Colour by option independently - for example, you can show Average Heart Rate on the y-axis and colour by Activity type to see the average heart rate for each activity and the pattern over time selected in the Look back period.
If you find a configuration that you prefer to the default settings, just use the Save settings button and that will become your new default for the Dashboard.
Pro tip
You may have noticed that on a small screen - typically a phone - the table of activities under the chart and the Summary section that you see on a larger computer display is not visible. To see it on a phone simply rotate the phone sideways and the extra display width will bring the table into view.