Sustainable page - what’s behind each point
Effort windows in colour, and a calculation improvement
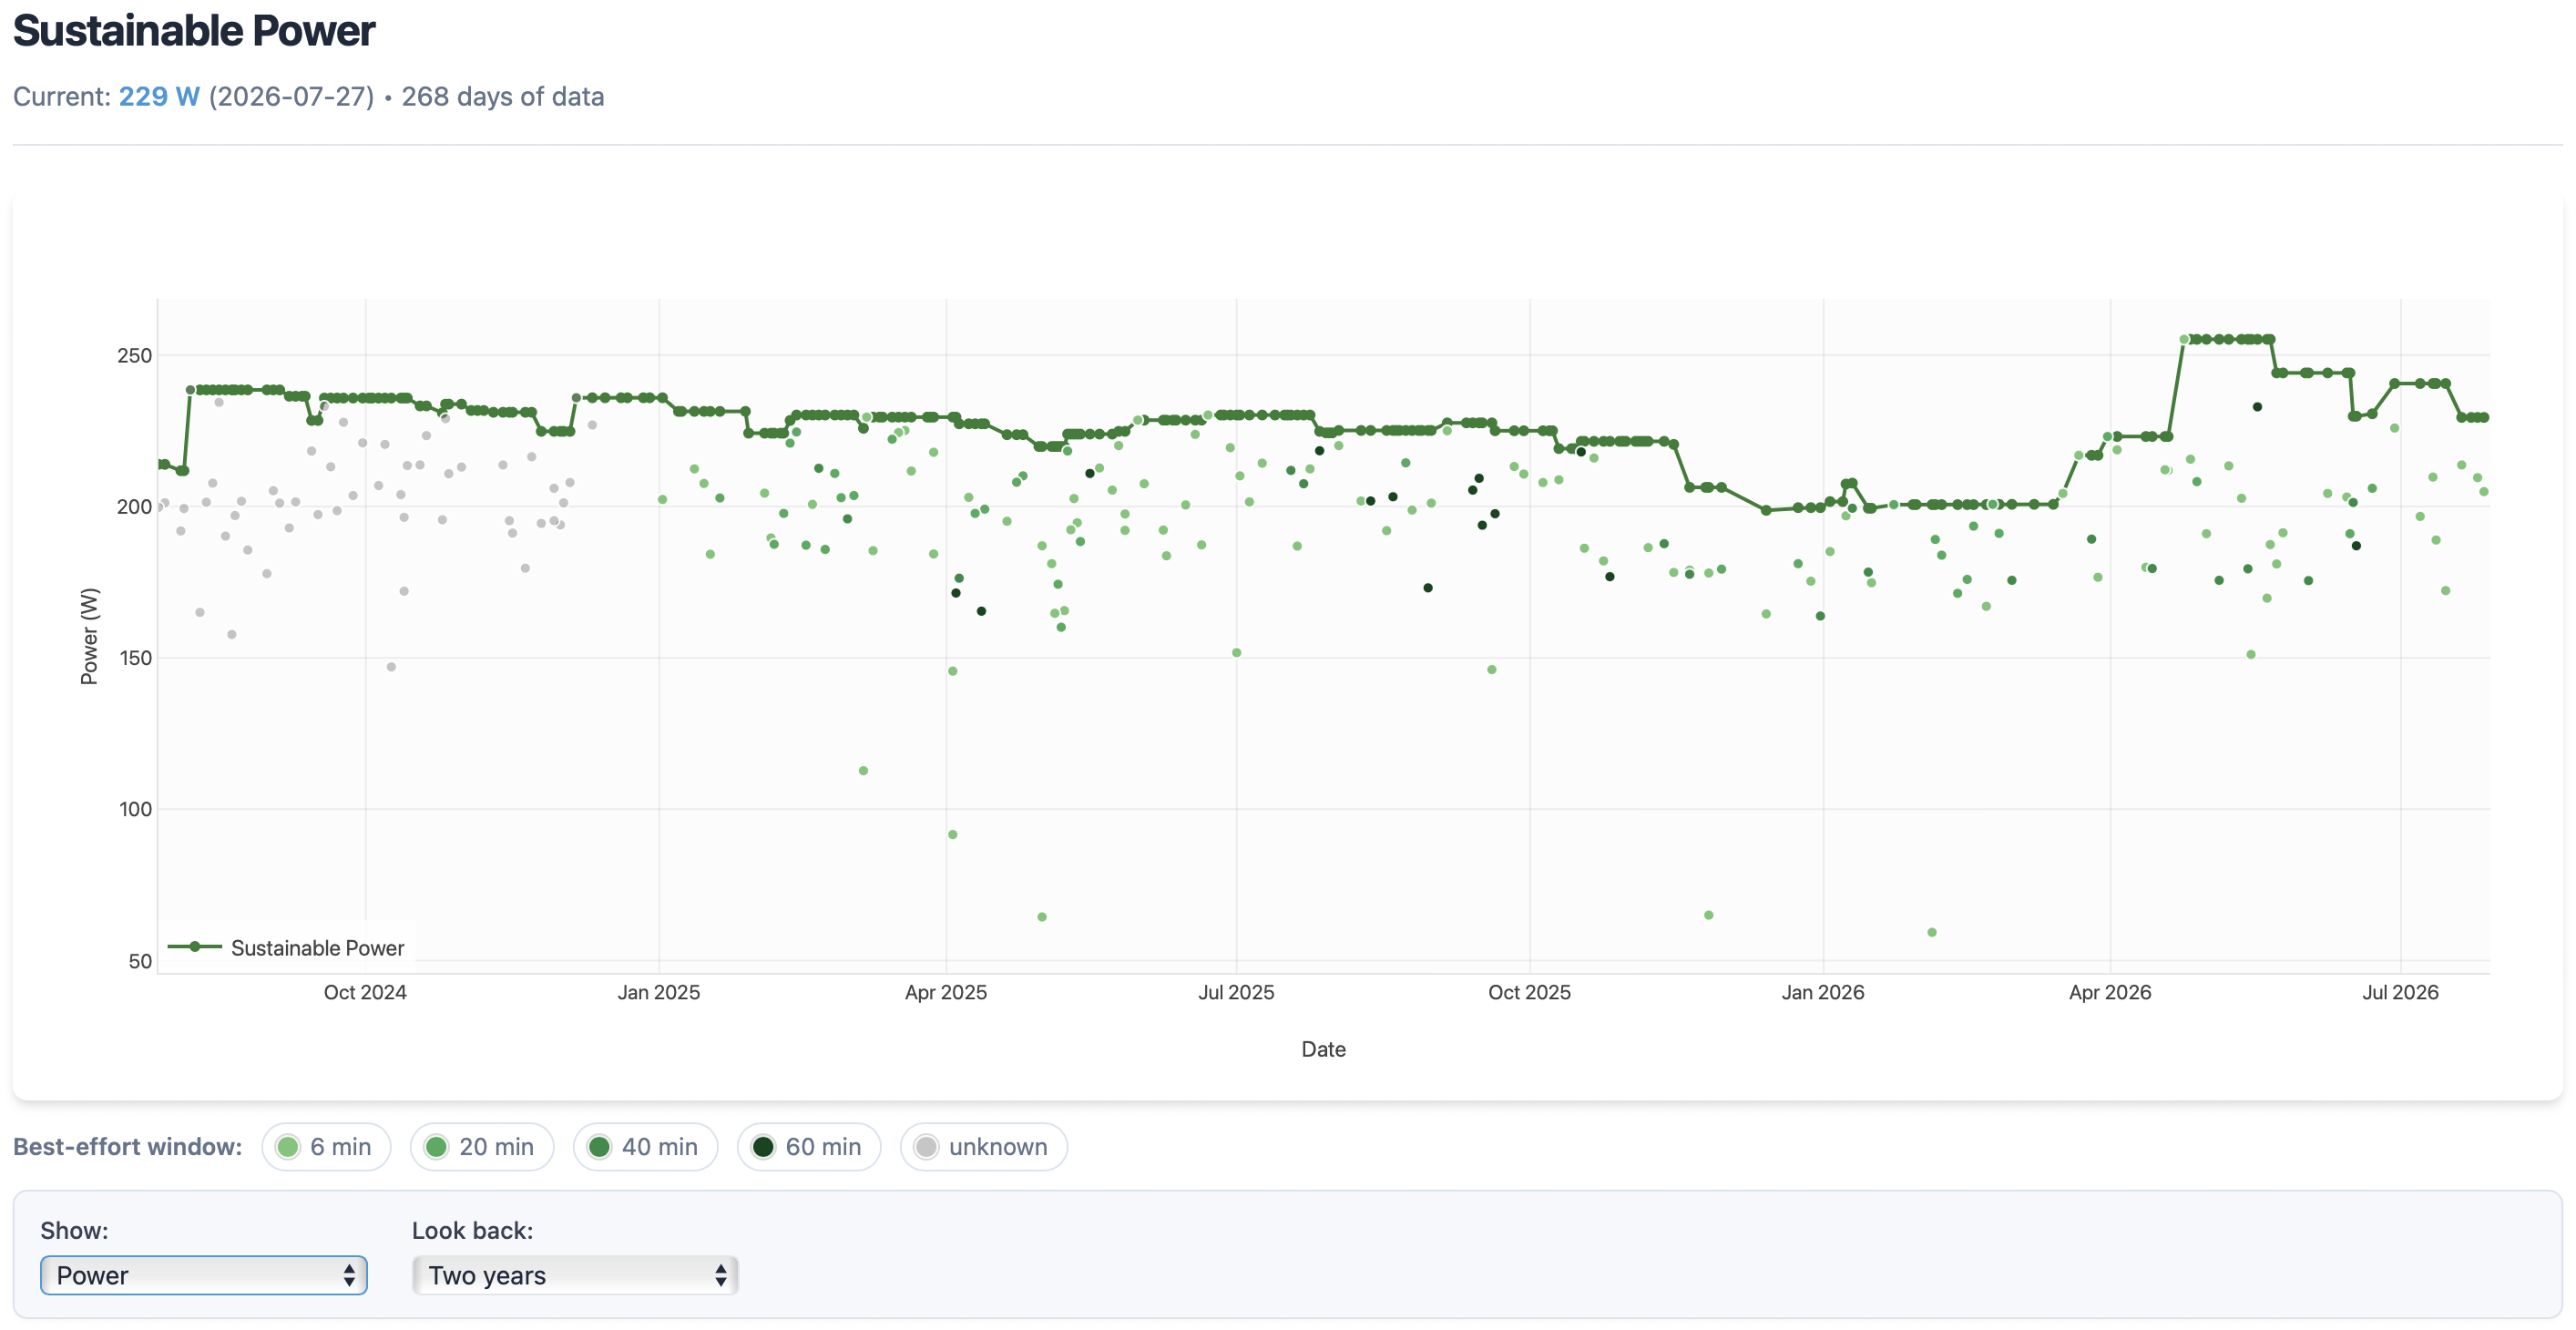
The Sustainable page plots a point for every activity, showing the sustainable heart rate or power that Crickles assesses from that activity alone, against the line showing your prevailing sustainable level. Those points have always been grey. They now carry rather more information.
Colour by effort window
To assess an activity, Crickles looks at your best sustained effort over four durations - 6, 20, 40 and 60 minutes - and takes whichever of those produces the highest figure once each is weighted appropriately. Until now the page didn’t tell you which of the four had won. Now it does, through the colour of the point: the lighter the shade the shorter the window, the darker the longer. Reds on the heart rate chart, greens on the power chart.
This is the same figure that appears as Best_HR_Bucket and Best_Power_Bucket in the activities table on the Dashboard, so if you want to check a particular ride you can find it there too. The window now also appears when you hover over a point, alongside the value, the date and the activity name.
It’s worth a look over a year or two. If your points are mostly light you’re a rider whose best efforts come in short bursts; if they’re mostly dark you hold your efforts for longer.
Showing and hiding windows
Under each chart there’s a key showing the four windows. These are clickable. Click 60 min and those points disappear; click it again and they come back. If you want to see only your hour-long efforts, click the other three off. It’s a quick way to pick a pattern out of a crowded chart.
Older activities
Some activities show up in grey, marked unknown. These are ones from before Crickles began recording which window produced the best effort, so there’s nothing to colour them by. They’re mostly at the left-hand end of a long look-back period and there’s nothing wrong with them.
A calculation improvement
Alongside the visual changes, sustainable heart rate and power are now calculated slightly differently. Some implausible figures arising from faulty recordings - a power meter that wasn’t reading, for instance - are now discarded rather than treated as measurements. The effect is small and in one direction: your sustainable levels may come out a little higher than before.
This applies automatically to new activities. If you’d like your earlier activities re-analysed on the same basis, refresh your data as described here - just hit Confirm Refresh, there’s no need to select the remove cached stream files option.
As ever, do get in touch if anything doesn’t look right.