Sustainable heart rate, zone-setting and regularity
Refined regularity tests improve heart rate metrics
Every time you record an activity with a heart rate trace (the recording from which the heart rate chart is graphed) Crickles checks for signs of disorderliness in either the sensor or your actual heart rate pattern. The result of this is shown as the Regularity flag on the Dashboard. Most activities show a Regularity value of Regular, meaning that nothing unusual was detected. Some other readings may indicate a potential issue with the equipment you used to record the activity. For example, OHM_jump typically indicates that the early part of the trace is unreliable - falsely low - probably as a result of poor perfusion while you’re warming up.
Whereas OHM_jump is usually only seen on sports watches, Check_strap is usually only seen on chest straps and may indicate a low battery or a failing strap.
The Regularity value that is most likely to arise from heart behaviour rather than from equipment is Irregular: while this can also be caused by a faulty strap, a frequent occurrence of Irregular or Unclear values can be associated with ectopic beats.
These heart rate traces are the basis of much of the analysis that you see in the Navigator and so these checks are a crucial data cleaning step.
Over the past fortnight two things have changed: the checks themselves have been refined, and discarding of non-Regular traces in subsequent analysis has become stricter.
Test tightening
Some of the regularity tests have been revised.
The detection of OHM_jumps has been refined to rule out progressive efforts that can generate an ostensibly similar shape.
The detection of Irregular values has also been refined and now picks up some irregularities that would previously have been missed.
Stricter construction of Sustainable HR and Zones
Your sustainable heart rate is a rolling maximum of your highest sustained efforts, and it anchors your heart rate zones. An activity now feeds the sustainable heart rate curve only if it passed all of the regularity tests and so has a Regularity value of Regular.
The reason for this can be illustrated in the chart below, which shows the distribution of maximum reported heart rates by athlete. The two curves break this into heart rate values taken from activities that have Regular regularity (shown in dark red) versus activities that have non-Regular values (shown in orange). In both the dark red and orange curves, the peak in the middle indicates that the most common all-time maximum beats per minute value is in the 180’s. However, on the right hand side of the distribution there are many athletes who have reported maximum values that are much higher. For activities marked as Regular, the distribution falls rapidly for values over 200 bpm, which is what we would expect. However, for non-Regular values there is a very significant fat tail of values extending to over 240 bpm. Heart rate values like this are likely to be mis-reports; even those that reflect true transitory high heart rates are unlikely to be repeatable and usable for zone-setting.
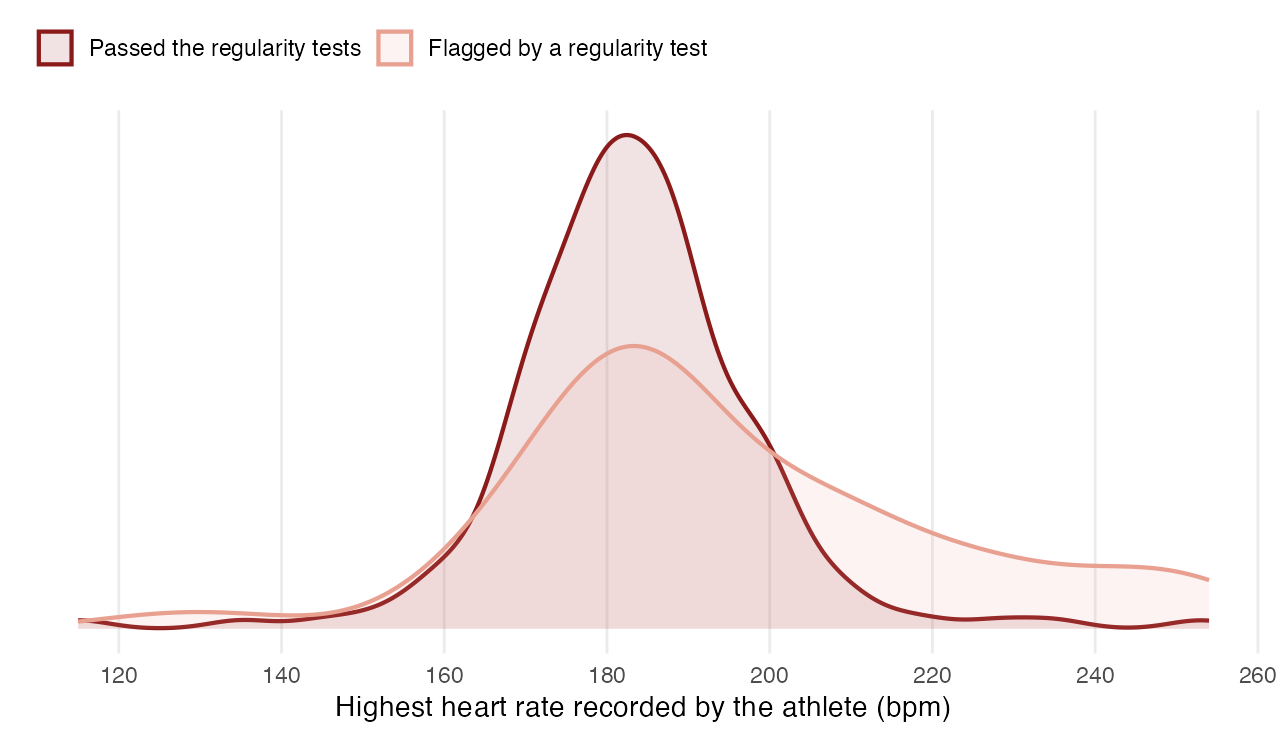
Because the Sustainable HR curve is based on maximum values, a single inflated peak could hold your sustainable heart rate - and your zones - too high for weeks. This has a consequential impact on Heart Rate Intensity (HRI) and Cardiac Stress Score (CSS) since if it wrongly appears that you can sustain a heart rate of, say, 190 bpm due to a recording error then a correctly observed activity in which you sustain 180 bpm might seem easier than it in fact was.
What you may notice
Your sustainable heart rate shown on the Sustainable page may drop a little. For most people the difference is a beat or two on some days; where a flagged activity had been setting the curve, the drop can be larger and the curve will now follow your regular efforts instead. Your zones move with it, and the intensity and stress figures for affected days are recalculated.
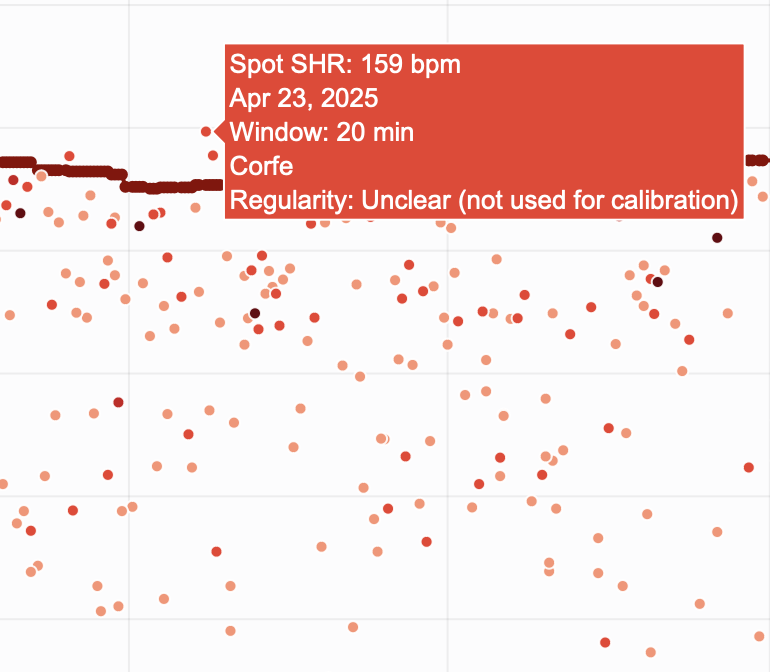
On the Sustainable page, some points may now sit above the curve. Those are flagged activities - they are still shown, but they no longer pull the line up. Hover over any point and the tooltip now shows its Regularity and whether it was used.
Your earlier activities
New activities pick all of this up automatically. To bring your history up to date, refresh your data as described here and hit Confirm Refresh.
As ever, do get in touch if anything doesn’t look right.