Why Crickles?
What it adds to the fitness tools you already have
Crickles analyses the cardiac demand of your training. It reads the activities you have already recorded, works out how hard each one was for your heart rather than for your legs, and tracks how that accumulates over weeks, seasons and years. It then compares your total over a period of your choosing with that of other athletes in your age group, and from there you can work back to the efforts that produced it. Crickles is free to use, and runs on top of intervals.icu.
Everything Crickles knows about your exercise arrives through intervals.icu, which is where your Garmin, Wahoo, Zwift, Coros or Polar data has already been gathered, so if you are reading this you are probably an intervals.icu user wondering what a further layer on top of it could be for. Intervals.icu does the collection, the planning and the workout building, and does them well; Crickles attempts none of those things. It reads your activity data through the official intervals.icu API, writes nothing back, and focuses on one question that training platforms address less carefully: how much cardiac stress are you accruing?
Your heart rate zones set themselves
Any heart-rate-based analysis needs an anchor, and most training platforms ask you to supply one - a maximum heart rate, or a lactate threshold heart rate (LTHR) - which in practice means either a laboratory visit or an all-out test that you then have to repeat as your fitness changes and as you age.
Crickles takes a different anchor, called sustainable heart rate: the heart rate that we estimate you could hold for a full hour. It is not a number you enter and it does not require a test, because it is derived from efforts you have already made. On every activity with a heart rate trace, Crickles takes rolling averages over a range of time windows, finds the highest sustained value in each window, converts the shorter windows to their one-hour equivalents using ratios derived from athletes with long and dense activity histories, and keeps the best of those as that day’s spot value. Your sustainable heart rate is then the average of the highest spot value in the last four weeks and the highest in the last twelve, so that it responds to recent form while remaining anchored in a longer record.
The practical consequence is that your calibration improves with every session containing a genuine sustained effort, wherever in the session that effort happens to fall, and that a period without such efforts shows up as a gradual decline rather than as a stale number that you have forgotten to revise. It is also, we think, a more dependable anchor than maximum heart rate, which is more liable to reflect a rogue value due to a device quirk and is hard to observe without a vvery intense effort that you may not want to make.
Your zones follow from it directly. The top of Zone 4 is your sustainable heart rate, and the other boundaries are set as proportions of it, so if your sustainable heart rate is 158 bpm then Zone 4 runs from 149 to 158, Zone 5a from 159 to 163, Zone 5b from 164 to 166, and Zone 5c is anything above that:
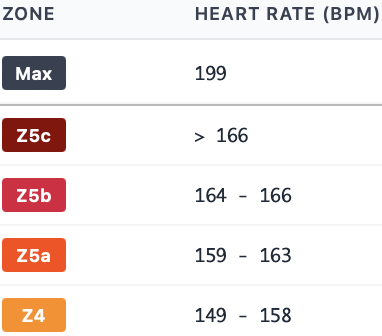
As your sustainable heart rate moves, every one of those boundaries moves with it, on the Zones page and everywhere downstream. The full derivation, with the R code that performs it, is published on this site under Research > Sustainable Performance.
One stress score, across every sport
From your heart rate trace and your sustainable heart rate, Crickles derives Heart Rate Intensity (HRI), a dimensionless measure of how demanding a session was relative to what you are currently capable of sustaining. An HRI of 1.0 means that you worked, in effect, at your sustainable ceiling; values above 1.0 occur on short or very hard efforts. HRI is not a simple ratio - it is predicted by a statistical model that adapts for each individual athlete, so the longer you use Crickles the more the estimate is yours rather than the population’s.
Cardiac Stress Score (CSS) then combines intensity with duration:
\[CSS = HRI^2 \times \frac{\text{moving time in seconds}}{36}\]
which is to say that one hour at your sustainable heart rate scores 100. Intensity is shown throughout as HRI multiplied by 100, so that ceiling reads as 100 rather than 1.0. Squaring the intensity term is deliberate: it gives progressively greater weight to harder work, following the same convention that Training Stress Score applies to power. An hour at an intensity of 80 scores 64, a third less than the hour at 100 despite being only a fifth easier, while a gentle ninety minutes at that same intensity of 80 scores 96 and so still comes out just below the steady hour despite being half as long again. On the Dashboard, hovering over any activity shows you both figures:
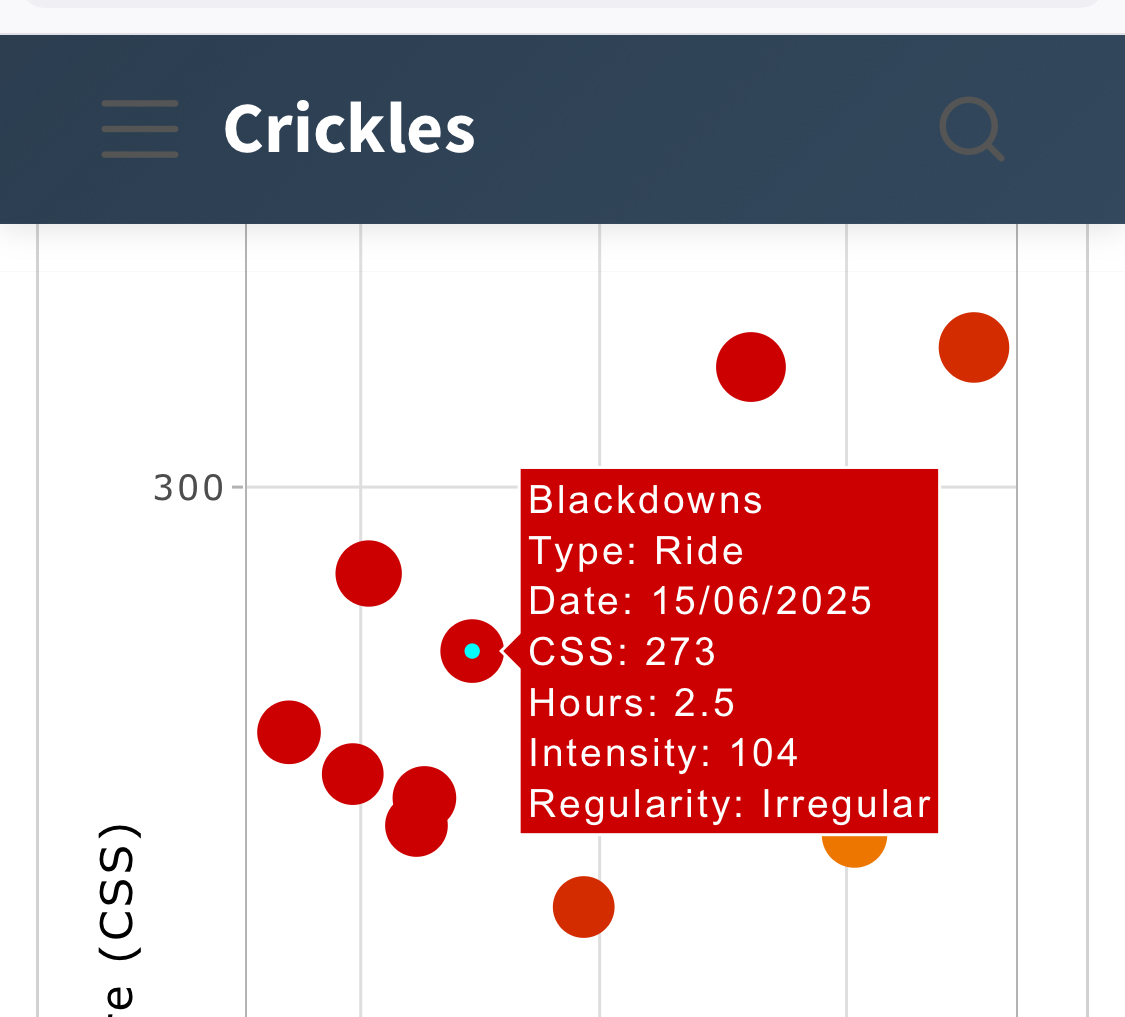
Because HRI is computed from the heart rate trace alone, it carries no assumptions about which sport produced it, and a run, a swim, a row and a ride can be placed on the same scale and added together, which is not something power or pace can support, since a watt on a bike and a watt on a rowing machine are not the same commodity.
There is a further feature that matters more than it might sound. When your heart rate data is missing or unusable - a flat strap battery, a watch that never found a signal - Crickles does not score the activity as zero and it does not drop it. It falls back to models trained on distance, elevation and speed, and those models are trained to reproduce what the heart rate model would have said, so the estimate lands on the same scale as the rest of your history. A month with two strapless rides in it therefore still gives you a usable total.
Crickles takes similar pains to ensure that your results do not vary unnecessarily according to the instrumentation that you use: the aim is consistent results across all of your activities, irrespective of how you record them.
Crickles checks whether your heart rate data can be trusted
This is the part of Crickles that we most often find has no real counterpart in the tools people are already using, and it is the part we would suggest you look at first.
Every heart rate trace is examined for signs of disorderliness in either the sensor or your actual heart rhythm, and the result is recorded as the activity’s Regularity. Most activities come back as Regular, meaning that nothing untoward was found. Check_strap is seen almost exclusively on chest straps and may indicate a failing strap or a low battery. OHM_jump appears on optical wrist sensors and typically means that the early part of the trace is unreliable - falsely low - probably because perfusion had not yet stabilised; Crickles also records the moment at which the reading becomes trustworthy. Irregular and Unclear cover short discontinuities under effort that are usually visible by eye on the Charts page.
Flagging bad data is useful in itself, but the reason it earns a section here is what Crickles then does with it: only activities that pass every regularity test are allowed to set your sustainable heart rate, and therefore your zones. The case for that is in the distribution below, which shows the highest heart rate each athlete has ever recorded, split according to whether the activity passed the regularity tests or was flagged by one of them.
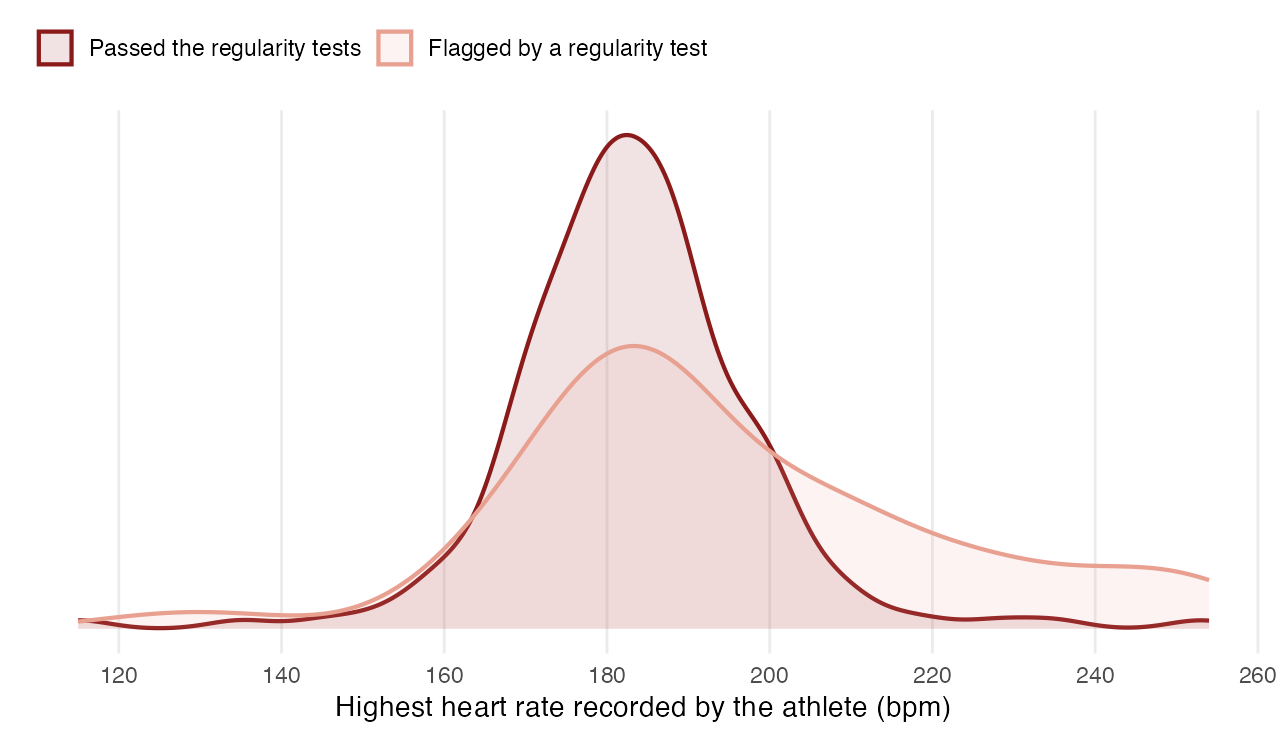
In both curves the peak sits in the low 180’s, which is where you would expect the most common all-time maximum to be. The dark red curve, for activities that passed the tests, then falls away quickly above 200 bpm. The paler orange curve, for flagged activities, does not: it carries a substantial tail running out past 240 bpm, into territory where the readings are far more likely to be artefacts of the sensor than records of anything a heart did.
Left unchecked, a single reading of that kind does lasting damage, because sustainable heart rate is built from maxima and one inflated peak can hold the whole curve up for a few months. If it wrongly appears that you can sustain 190 bpm, then a correctly recorded ride on which you genuinely sustained 180 will look easier than it was, its intensity will be understated, and so will the cardiac stress you are credited with. Excluding flagged activities from the calibration costs you nothing, since they are still shown, still scored and still counted - they simply do not get a vote on where your ceiling sits.
Fitness, Fatigue and Form that you can test
Fitness and fatigue curves are common to most training platforms, and they are almost always built on the same two constants: an exponential decay of 42 days for fitness and 7 days for fatigue. Those numbers are inherited rather than derived, they assume that everyone adapts and recovers at the same rate, and there is generally no way to find out whether they describe you.
On the FitFat page both constants are sliders, and the curves redraw as you move them. More to the point, if you ride with both a heart rate monitor and a power meter, Crickles will tell you whether a given pair of values is any good, by testing them against two things that actually happened in your training: whether your breakthrough days, the rides on which your sustainable power rose, fall on peaks of Form, and whether the power you produce for a given cardiac effort tracks the Fitness curve. Our post on the FitFat page works an example through, with the statistics.
Whether or not you choose to tune anything, being able to ask the question at all seems to us a better position than accepting 42 and 7 on trust.
How much is too much?
Everything above quantifies the demand that your training places on your heart. A more significant question is whether or not that demand is exceptionally high, and here there is no settled science on how much endurance exercise of mixed types and styles is safe. The dose that matters varies with the sport, the intensity, the age and the constitution of the athlete, and the long-term controlled study that would answer the question properly has not been done and realistically is never going to be. What can be said is that the risks that are associated with endurance exercise appear to concentrate at the far end of the distribution rather than in the middle of it. This suggests that the useful, actionable question for an individual athlete is not “is my volume of exercise safe?” but “whereabouts in the distribution do I sit?”
That is what the CSS vs Peers page is for. It takes the cardiac stress you have accumulated over a period you choose, from one month up to a year, sets it against other Crickles athletes in your age band over the equivalent seasonal period, and shows the result as a boxplot with your own figure marked in red:
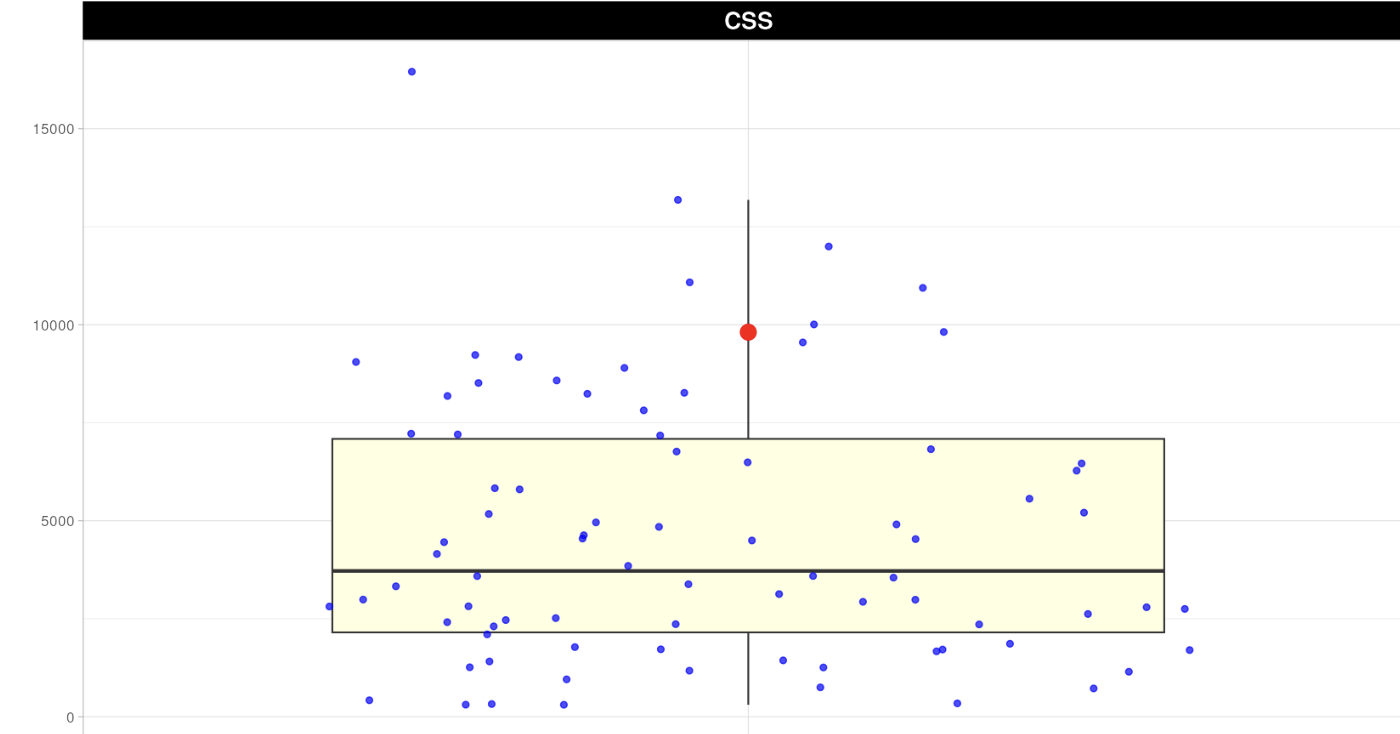
Here’s an example of what a Crickles user might see. Each dot represents the total Cardiac Stress Score (CSS) accumulated by one person over three months. The red dot shows the total CSS of our user. Each small blue point represents one of our user’s peers and the lines and shapes show the distribution of their CSS values: the yellow box covers the middle half of them, running here from about 2,100 to about 7,100, and the darker line drawn across the box is the median at around 3,700. In this example our user’s CSS sits at about 9,800, which is well above the top of the yellow box and much greater than - something like two and a half times - the median CSS accumulated by age band peers over the same three months. The fact that our user’s CSS is comparatively very high is worth them knowing. What they decide to do about it, if anything, is up to them; where that load comes from is what the rest of the Navigator is for, beginning with the three component panels on this same page.
We would put the inference no more strongly than this: sitting at the very top of the pack seems to us more likely to carry risk than sitting in or near the yellow box, even though no peer-reviewed long-term study establishes that it does. The distribution of other users is standing in here for evidence that does not exist, rather than serving as evidence in its own right. It is a reference point and not a threshold, and a high position should not be read as a diagnosis any more than a low one should be read as a licence.
Two things temper the reading. The comparison group is other Crickles users, who are self-selected and on the whole a committed cohort, so the median here is not the median of the general population and being at the top of this particular crowd means doing a very great deal indeed. Also, the page breaks the comparison into its components - intensity, the number of activities and their duration - which matters more than it may appear, since an athlete sitting high on the volume of steady riding is in a quite different position from one sitting equally high on intensity, and the components are what tell you which of the two you are.
All of this speaks to the potential long-term risk arising from consistently very high levels of endurance exercise, which has to be balanced against the many significant health benefits, and the enjoyment, that it can bring. The acute risk of dying during a single event is more circumscribed and better studied. Our review of the academic literature on mortality during marathons can be found here.
Heart rhythm, and a necessary caution
Crickles began with an interest in cardiac irregularity, and the Regularity flag carries more than a data-cleaning role.
Working with survey responses from around 190 cyclists across more than 130,000 activities, we found that the proportion of an athlete’s activities flagged as Irregular is significantly associated with a self-reported diagnosis of a heart rhythm condition such as atrial fibrillation. Mark Dayer, the cardiologist we work with, suggested at the time that the likely explanation was that the flag was picking up ectopic beats, which are themselves common but can precede rhythm problems. We were subsequently able to test that: on 1,531 cycling activities carrying beat-to-beat interval data, ectopic beats can indeed be detected directly from sports device recordings, and their presence is strongly associated with the Irregular flag, with more ectopics found as the flag moves from Regular through Mildly_irregular to Irregular. Both analyses are published on this site under Research.
It is very important to understand that Crickles is in no sense a medical tool and cannot diagnose your cardiac health. A high incidence of Irregular activities does not mean that you have a heart problem, and an absence of them certainly does not mean that you do not. Mark’s advice is that if you do see a raised incidence, the useful thing is to correlate it with symptoms - a thumping or irregular sensation in the chest, chest pain, unusual breathlessness or dizziness - and to get things checked if any of those are present. The research is also, so far, restricted to cyclists, because chest straps predominate in cycling and the detection leans on characteristics of the strap signal.
What Crickles does not do
Crickles does not plan your training, build workouts or manage a calendar as intervals.icu does. It writes nothing back to your intervals.icu account. There are no Social functions and at the time of writing Crickles does not use non-exercise-related data such as sleep quality that your devices may also record.
It is also free, which has a consequence worth knowing about. The Navigator runs on modest cloud infrastructure with less redundancy than a subscription service would carry; up-time over many years has consistently been better than 99%, but it can occasionally falter.
Getting started
You need an intervals.icu account with activities in it, and those activities need to reach intervals.icu directly from your devices or platforms, and not only by way of Strava - the Strava API terms of use prevent applications such as Crickles from processing activities that arrived that way. Heart rate data is what makes Crickles interesting, so a strap or a wrist sensor is effectively a prerequisite, and a power meter unlocks the additional analysis described above.
From there it is a matter of creating a Crickles login, filling in your date of birth so that peer comparison has something to work with, and authorising Crickles to read your intervals.icu data. The full walk-through is on the Get Started page, and the first load of your history typically takes a few minutes.
If anything does not look right, or if you disagree with how any of this is calculated, we would like to hear about it - the Contact page is the quickest route.